The Challenge
Vineyard decisions get made per block, but vines vary plant by plant. Tracking phenology at the individual-vine level meant combining field measurements, drone imagery, and prediction into one tool.
The Solution
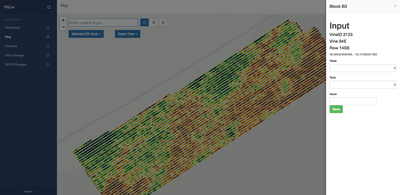
An Angular application over PHP and Python backends where every vine is a point on a Leaflet map. Field crews record in-situ measurements against individual vines; multispectral drone imagery is registered and segmented with OpenCV to track NDVI per vine over time; models trained on the accumulated history predict phenological stage.
What I Built
Per-Vine Data Capture
In-situ measurements recorded directly against a specific vine on the map.
NDVI From Drone Imagery
OpenCV image registration and segmentation turn multispectral flyovers into a per-vine NDVI time series.
Phenology Prediction
Keras and scikit-learn models extrapolate from measured vines to the rest of the block.
Outcome
- Phenology tracked and predicted at a resolution vineyard managers previously couldn't see
Built With