The Challenge
Vineyard decisions get made per block, but vines vary plant by plant. Imagery is normally read per zone or per acre, which is too coarse to act on, and the fruit measurements that would calibrate it sit in a separate notebook.
The Solution
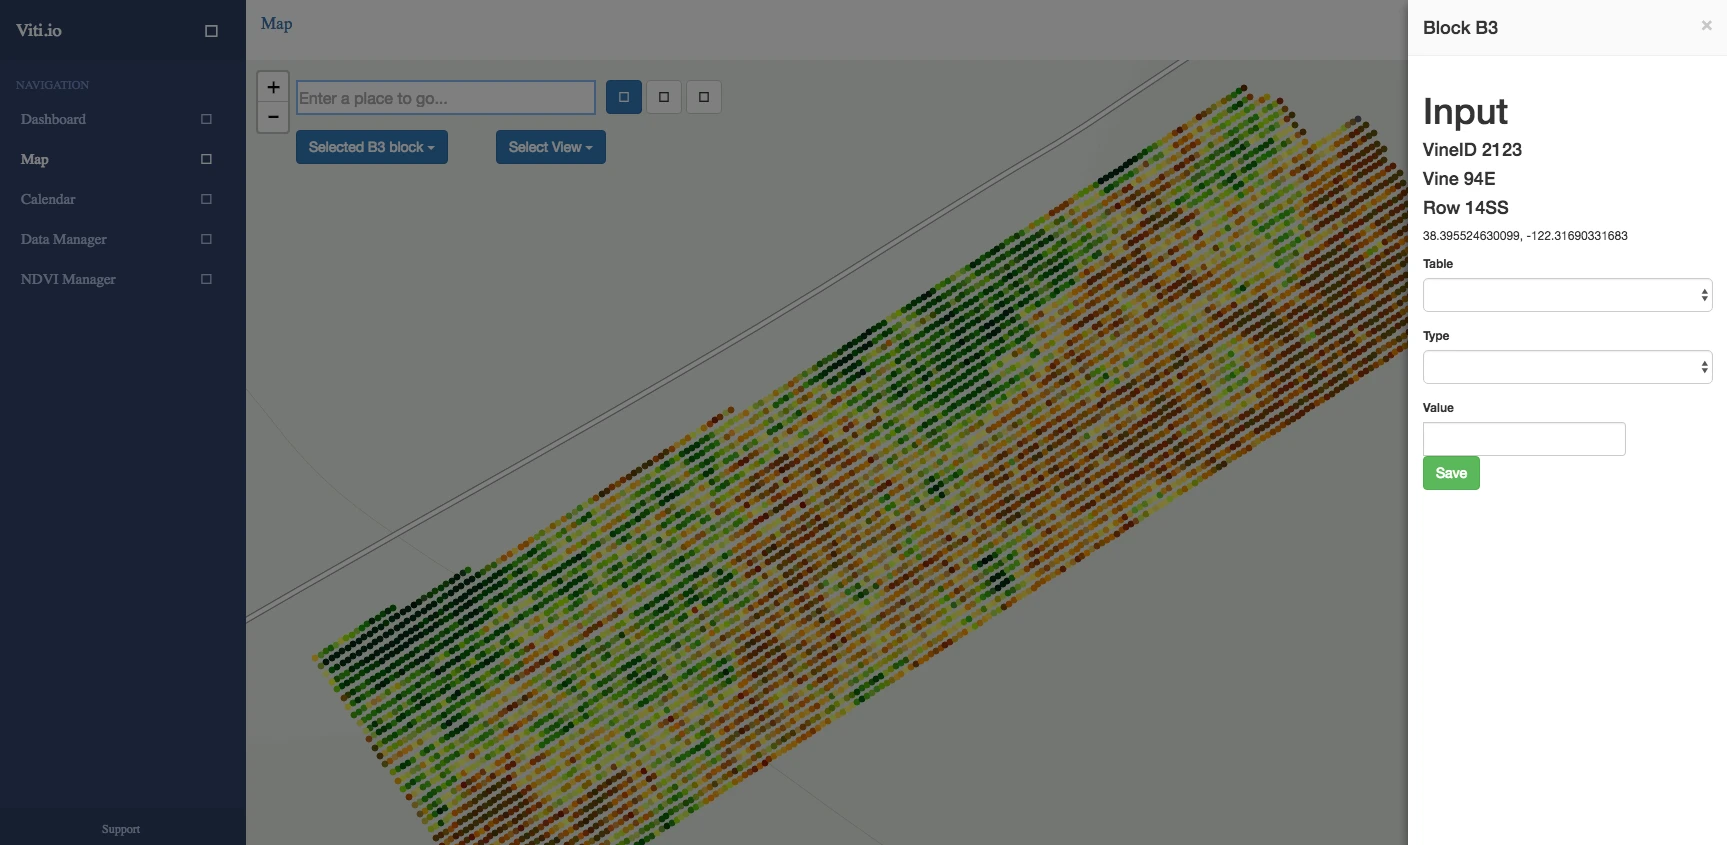
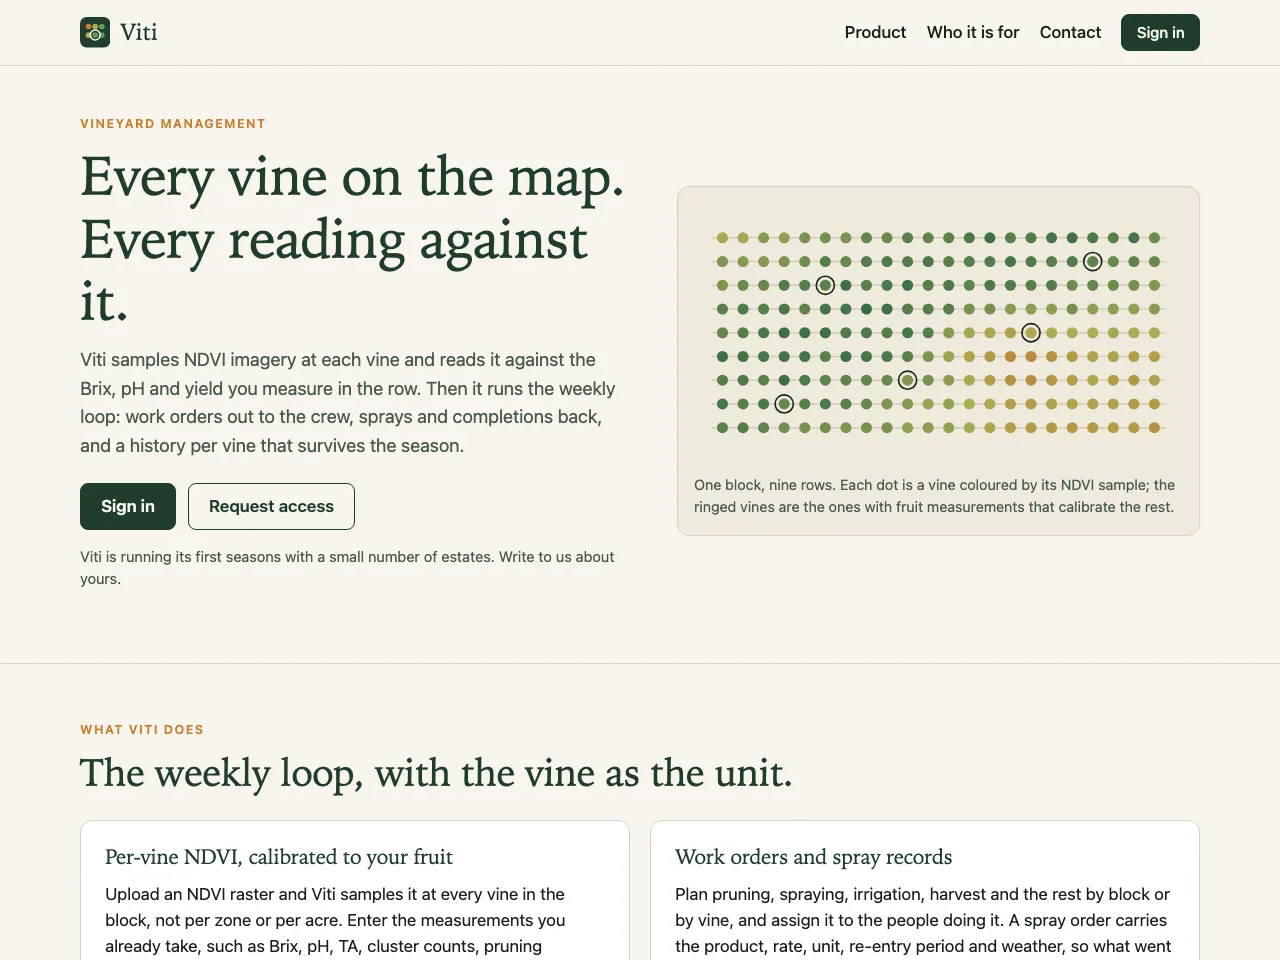
Every vine is a point on the map. Multispectral imagery is registered and sampled at each vine rather than averaged over a zone, then read against the Brix, pH and yield measured in the row; models trained on the accumulated history predict phenological stage. Around that runs the weekly loop: work orders out to the crew, sprays and completions back, and a history per vine that survives the season.
What I Built
Per-vine data capture
In-situ measurements recorded against a specific vine on the map, not a block average.
NDVI from drone imagery
OpenCV registration and segmentation turn multispectral flyovers into a per-vine NDVI time series.
Calibrated to your fruit
Brix, pH, TA and cluster counts from the row anchor what the imagery says.
Phenology prediction
Models extrapolate from measured vines to the rest of the block.
Work orders and spray records
Pruning, spraying, irrigation and harvest assigned by block or by vine, with product, rate and re-entry period.
History per vine
A record that persists across seasons rather than resetting with each pass.
Outcome
- Phenology tracked and predicted at a resolution vineyard managers previously could not see
Built With